Browser developer tools let you view and edit HTML, CSS and JavaScript in real time. You can inspect any element on a page, test CSS changes instantly and spot console errors without affecting your live site.
These tools help you troubleshoot website error codes and fix redirect errors by checking network requests. Developer tools only show client-side code. For server-side issues like PHP errors, check your server access logs instead.
Open developer tools in Chrome
Chrome provides three methods to access developer tools. Each method opens the same interface with tabs for elements, console and network diagnostics.
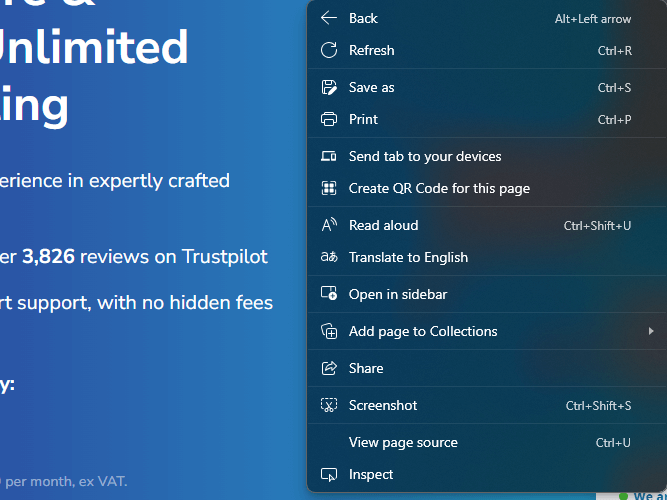
- Right-click any page element.
Select Inspect from the menu. This opens developer tools with the selected element highlighted. - Use keyboard shortcuts.
PressF12to open all developer tools, or pressCtrl + Shift + Cto activate element selection mode.
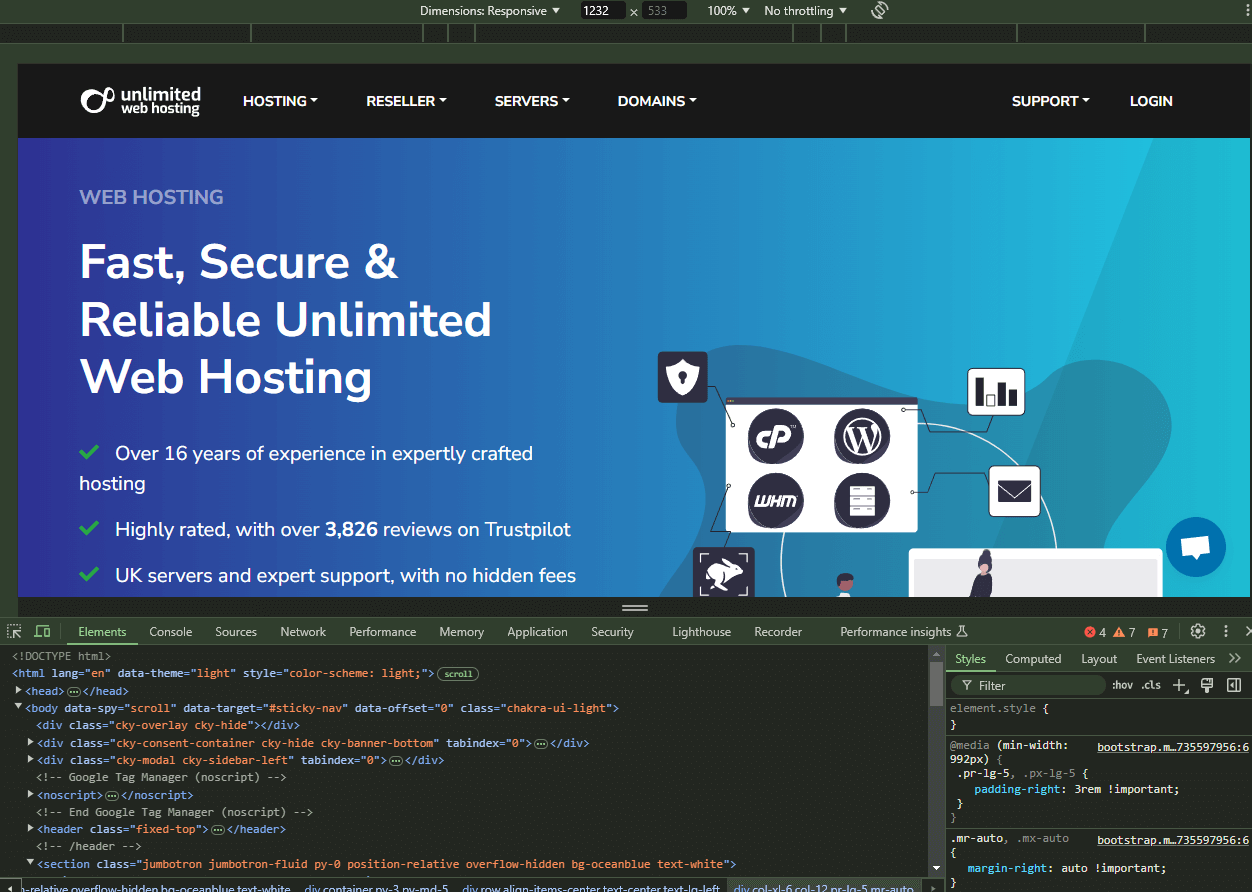
The Elements tab shows your page structure, the Console displays JavaScript errors and the Network tab tracks all resource requests. You can now inspect and modify page elements.
Open developer tools in Firefox
Firefox developer tools work similarly to Chrome. You access them through right-click menus or keyboard shortcuts.
- Right-click any page element.
Select Inspect from the menu to open developer tools. - Use the keyboard shortcut.
PressCtrl + Shift + Cto activate element selection mode.
Firefox organises its tools across tabs including Inspector, Console and Network. The interface layout differs from Chrome but provides the same functionality.
Open developer tools in Edge
Edge uses the Chromium engine, so its developer tools match Chrome’s interface. You access them through the same methods.
- Right-click any page element.
Select Inspect from the menu.
- Use keyboard shortcuts.
PressF12to open all developer tools, or pressCtrl + Shift + Cfor element selection mode.
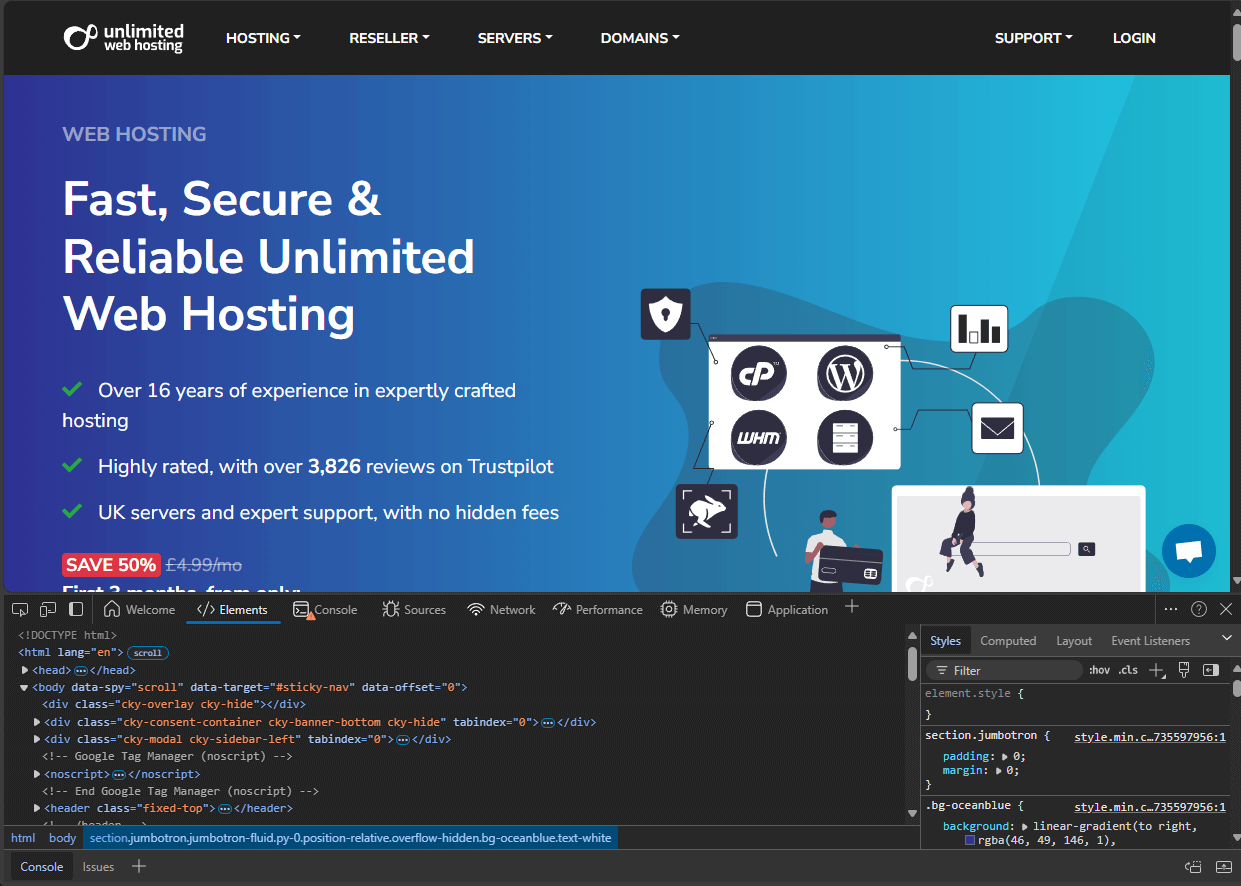
Edge developer tools include the same tabs as Chrome: Elements, Console and Network. You can cycle through these tabs to diagnose different types of issues.
Open developer tools in Opera
Opera also uses Chromium, but its keyboard shortcuts differ slightly from other Chromium browsers.
- Right-click any page element.
Select Inspect from the menu to open developer tools. - Use the keyboard shortcut.
PressCtrl + Shift + Ito open all developer tools.
Opera’s developer tools match Chrome’s layout and functionality. The interface includes the same tabs for inspecting elements, viewing console output and monitoring network activity.
Wrapping up
You can now access developer tools in Chrome, Firefox, Edge and Opera. These tools let you inspect page elements, test CSS changes and debug JavaScript errors without affecting your live site.
Use the Elements tab to examine HTML structure, the Console to spot JavaScript errors and the Network tab to track resource loading. For more web design learning resources, read our guide to web design blogs worth following.
If you run into any trouble, get in touch and our team will be happy to help.

Ready to get started?
Launch your website with our reliable cPanel hosting with unlimited bandwidth and expert support.
Get cPanel Hosting