Website logs record every request, error and connection your server processes. You need these logs to diagnose server issues, identify why a website went down or understand what caused an error.
You will access different log types depending on what you are investigating. Access logs record all requests made to your website. Error logs contain diagnostic information about problems the web server encountered. SSL logs track secure HTTPS connections. Both Plesk and cPanel provide direct access to these logs through their control panels.
Before you begin
- You need access to your Plesk or cPanel control panel.
- Logs download in plaintext format. Use CTRL+F to search for specific entries.
Access Apache logs in Plesk
Plesk organises logs by domain. Each domain in your subscription has its own log files, which makes it easier to isolate issues affecting a specific site.
- Log in to your Plesk control panel.
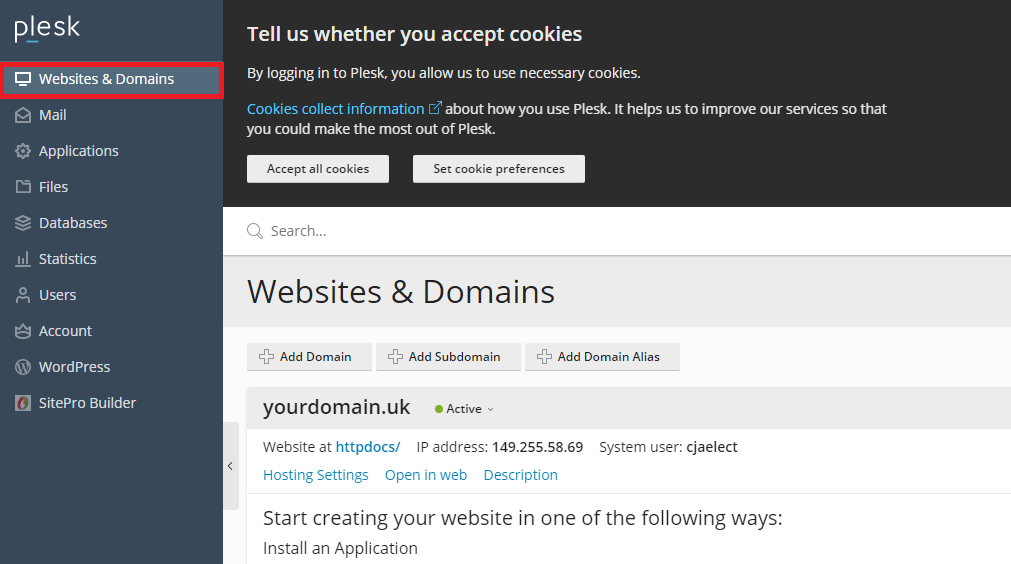
Access this directly via the URL provided in your welcome email or through your client area. - Open the Websites & Domains section.
Click Websites & Domains in the left sidebar. This displays all domains in your subscription.
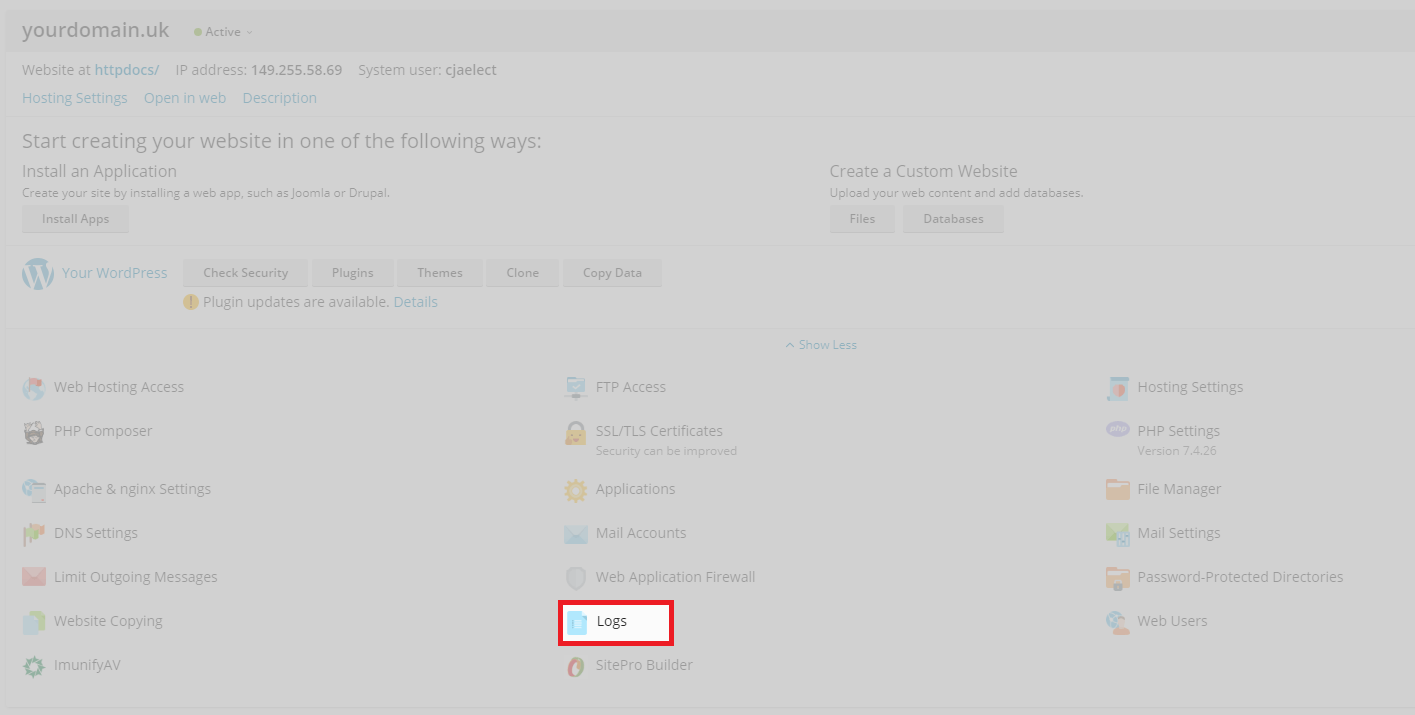
- Select the domain you want to investigate.
Each domain displays a Logs icon. Click this icon for the domain you are troubleshooting.
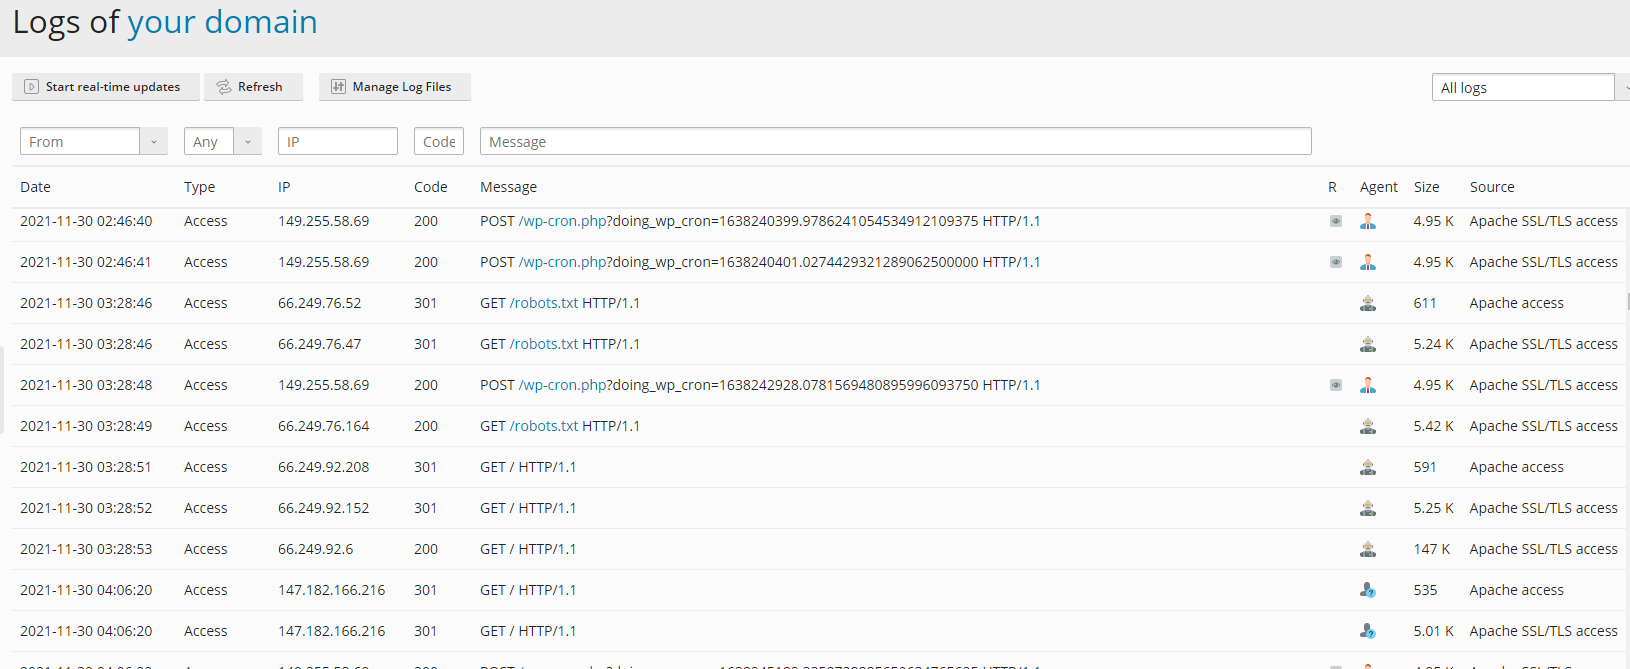
- View the log entries.
Plesk displays all entries for the selected log type. The default view shows recent activity.
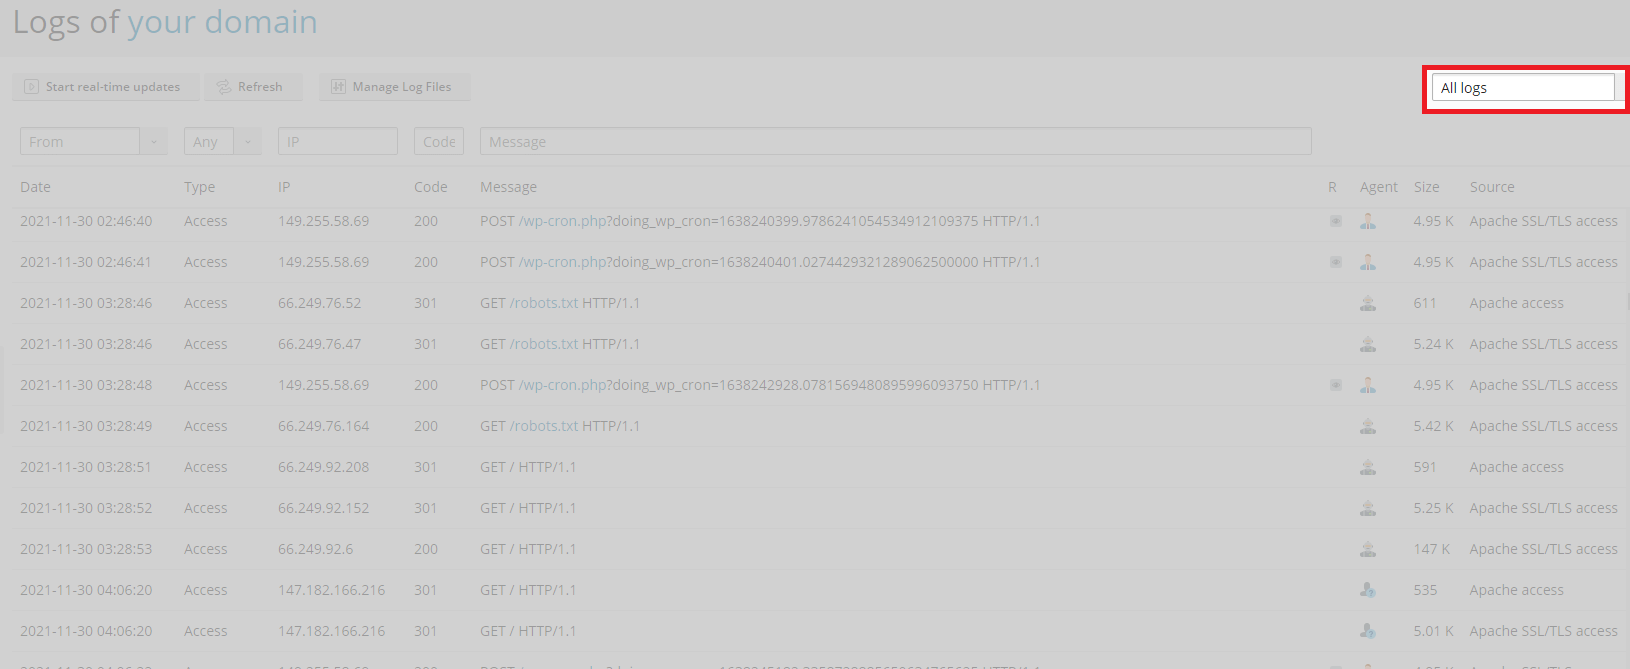
- Change the log type if needed.
Use the dropdown menu at the top of the page to switch between access logs, error logs and other log types. This allows you to focus on the specific information you need.
You can now review log entries to identify errors or unusual activity. Plesk provides a complete list of available log types in their documentation.
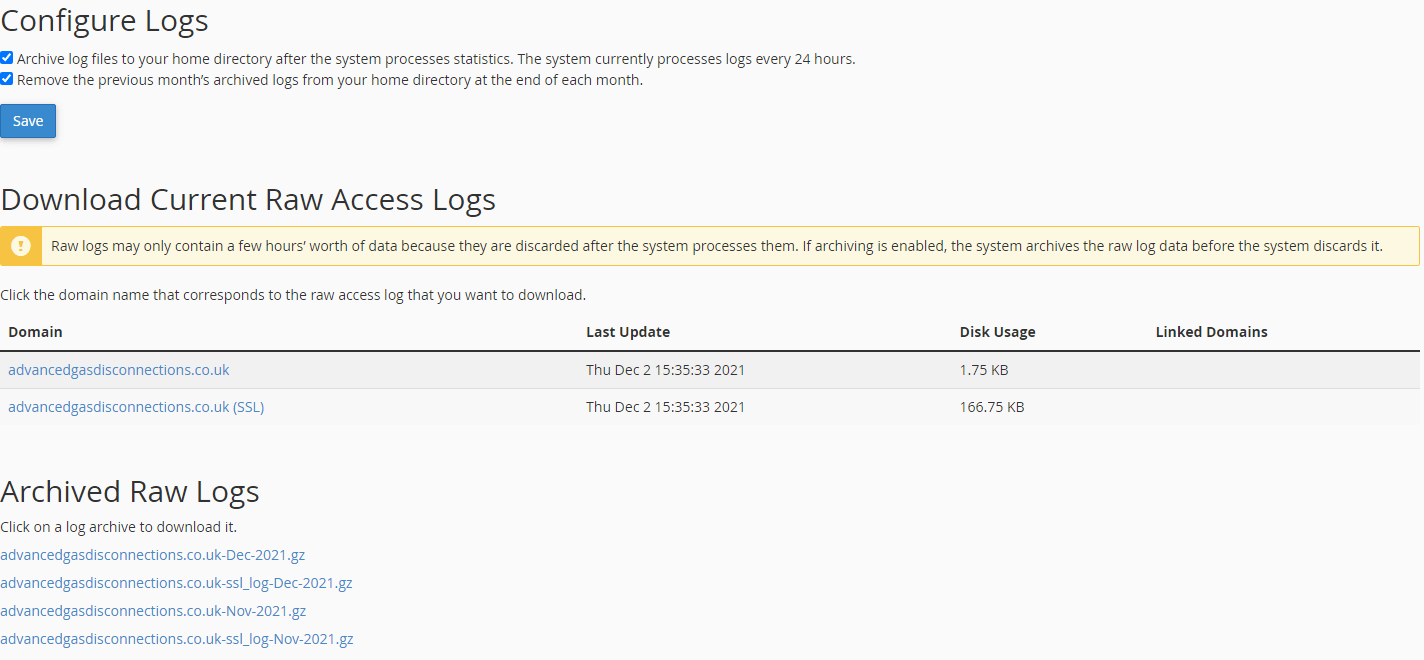
Access raw logs in cPanel
cPanel displays logs through the Raw Access tool. This shows logs for all domains on your account in a single table, including both SSL and non-SSL versions. Archived logs are available in monthly increments as tar.gz files.
- Log in to your cPanel control panel.
Access this through your client area or directly via the URL provided in your welcome email. - Open the Raw Access tool.
Scroll to the Metrics section and click Raw Access. This opens the log management interface.

- View or download logs.
The page displays a table of all domains on your account. Click a domain name to view its current logs or click an archived log file to download it. Archived logs are organised by month.
You can now review log entries to diagnose issues. The logs download in plaintext format, so use CTRL+F to search for specific errors or patterns.
Wrapping up
You now know how to access website logs in both Plesk and cPanel. These logs help you diagnose server issues, track down errors and understand what happened when a site went down.
Review your logs regularly to spot patterns before they become problems. Our guides on fixing website error codes and understanding LVE resource limits provide additional context for common log entries. You can also use the ping command alongside log analysis for network diagnostics.
If you run into any trouble, get in touch and our team will be happy to help.

Ready to get started?
Launch your website with our reliable cPanel hosting with unlimited bandwidth and expert support.
Get cPanel Hosting